NEWSLETTER: April 2026
Skylims QC insights Part 3 - How do I configure QC in Skylims?
Edition 4
5-minute read
In our March issue we showed you how to read your QC status at a glance. With this issue we take you through the Skylims configuration to set up the elements of your QC plan, document your QC results and how Skylims supports the relationship between QC and patient results.
1. Your IQC strategy and Skylims QC
An IQC strategy is the laboratory's documented plan for every analyte and it should describe what you measure, how to detect problems, and what to do about it. The CLSI C24 guideline breaks up the process to develop a QC plan into 6 steps:
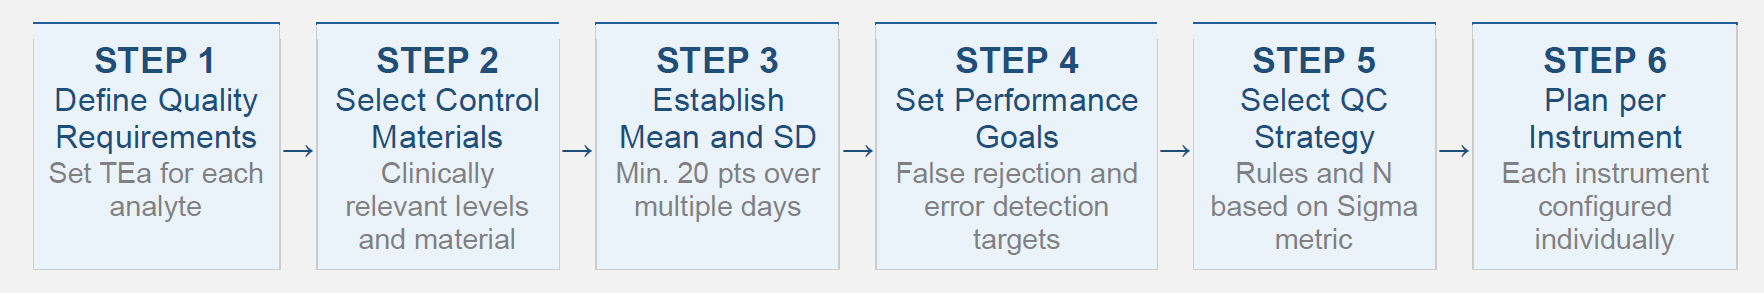
So, how do I build this QC 'puzzle' in Skylims?
QC setup in Skylims consists of five pieces: (1) Level, (2) Control Material, (3) Lot, (4) Control and (5) Control Group. The diagram demonstrates the simple steps that you can follow to set up your first QC.
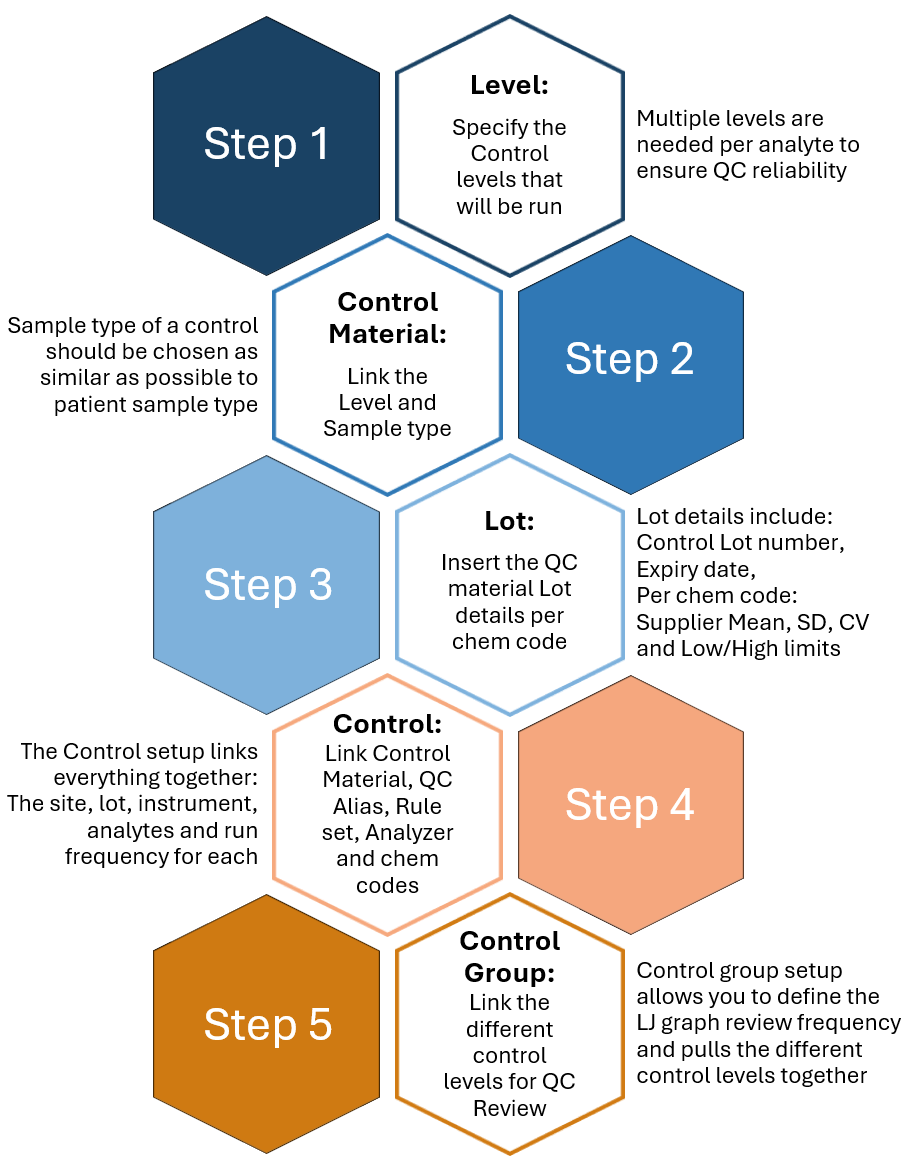
Each configuration allows you to define specifics of your QC plan:
🔹 Define the sample type and method of the control
🔹 Input supplier mean, SD and CV per chem code also allowing input of configured values
🔹 Determine QC run frequency per chem code, per control (e.g. HbA1C every 12 hours)
🔹 Specify the QC rules to be applied per control; various rule sets can be chosen from
🔹 Specify the LJ graph review frequency for the control levels.
Terminology
| Term | Definition |
|---|---|
| Chem code | Unique identifier for a specific analyte, serves as a link between the instrument and LIS |
| QC Alias | The identifier for the Control defined on the instrument used as the QC Sample ID in the Skylims QC Control. |
| TEa | Total allowable error. Read more about this topic here: Total Allowable Error (TEa): How Much Error Can Your Laboratory Allow? |
How do I enter and interact with the QC results?
The QC Result routine is the focal point for managing QC results. From here, you can view and enter QC results, take corrective actions where needed and view LJ graphs for the active lots. The routine also includes auditability – all actions of the user are recorded with quick 'audit' functions on every field, with an expanded feature for documenting corrective actions.
💡 Quick Tip:
You can easily find information on a chem code in the Skylims Interface Result List.
Details readily available include: Type (QC / Patient), Sample ID (Req number or Control Alias), Chem Code, Results (QC or Patient), Run Time, Lot number and Linked status
I have all this QC data; how do I relate it back to my patients?
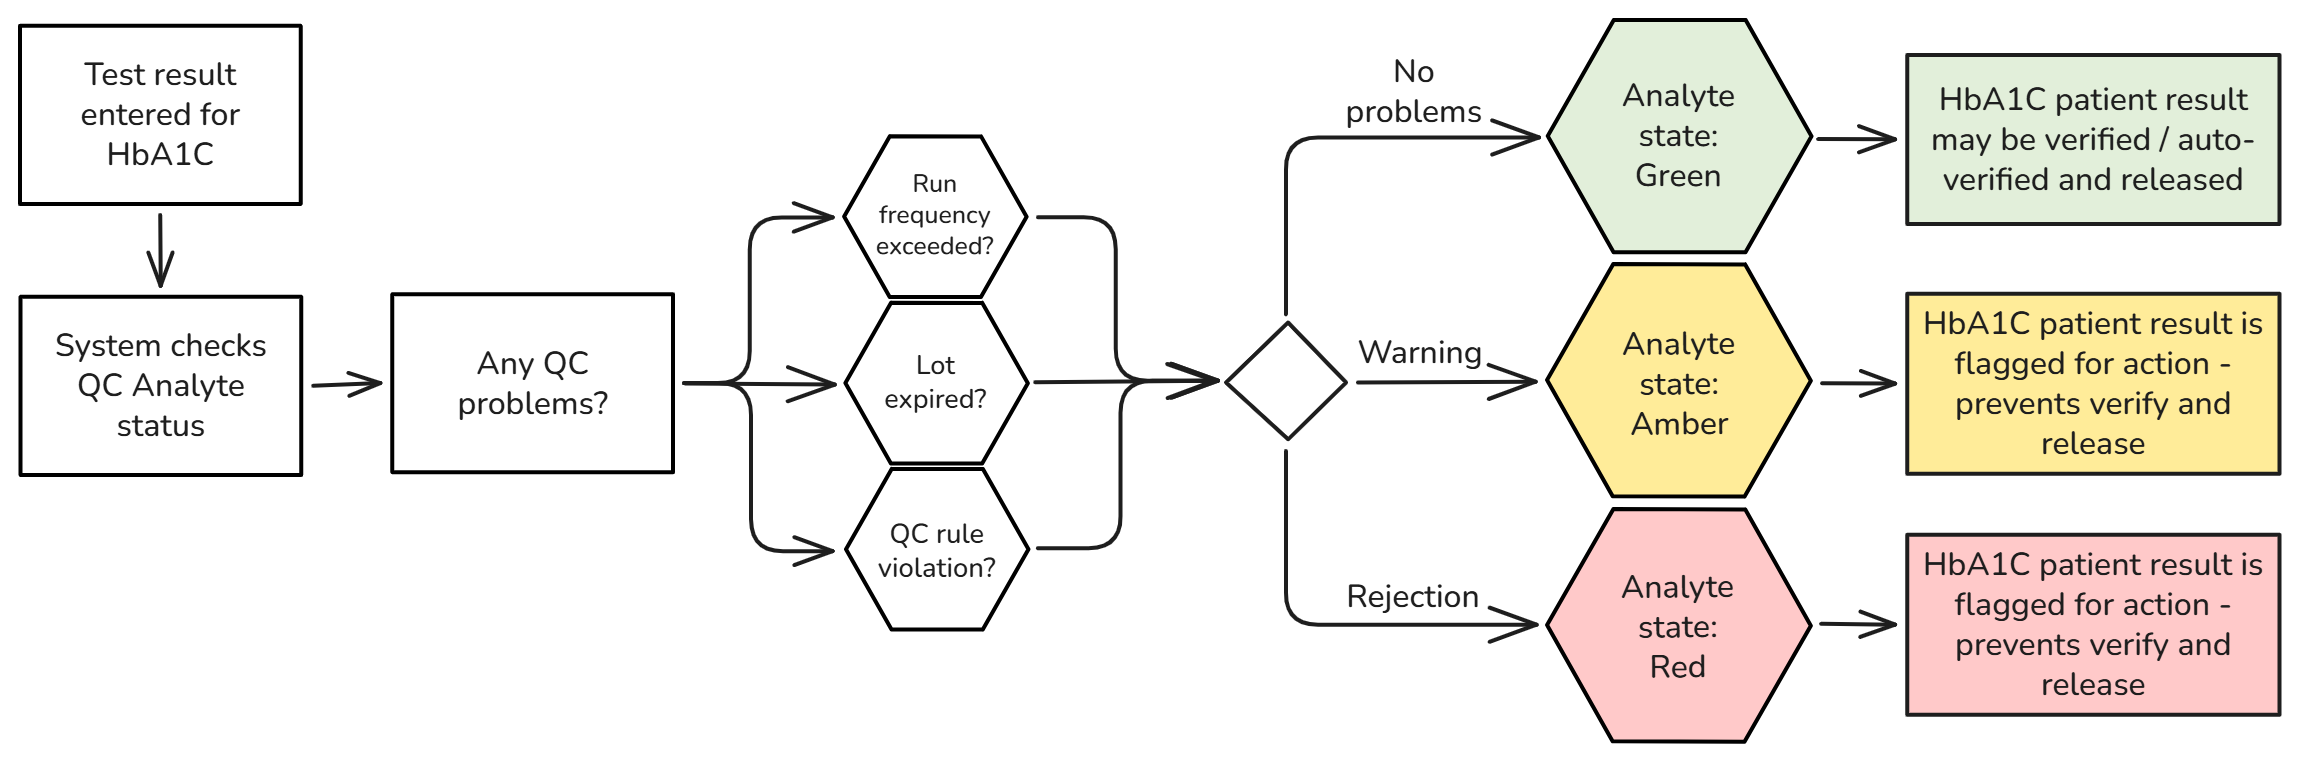
One of the greatest benefits of having your QC configuration in Skylims is real-time visibility of your QC performance against the patients' results. The Analyte state feature shows, per chem code, if a patient's result is reliable or not. The Green-Amber-Red system flags results in real-time if there is a problem with the QC - giving the lab tech the power to act fast and produce reliable results. Knowing the analyte state for a particular test (e.g. under control, out of control, or not controlled) acts as a gateway for implementing auto-verification, which can significantly improve efficiency and turnaround times.
Below is an example of a workflow where the Analyte state improves the overall reliability of results:
Next up: I have an audit soon. How does Skylims QC help me?
In our next edition, we will take a look at what SANAS assessors use to assess ISO 15189:2022 compliance and how Skylims supports you to gather the evidence you need.
Examples of configuration items that SANAS assessors will look for
ISO 15189:2022 Clause 7.3.7.2 | SANAS F 243-02
| Configuration item | ISO Clause |
|---|---|
| QC plan documented for each analyte: control materials, mean, SD, rules and run frequency | 7.3.7.2 a-e |
| QC data reviewed in regular intervals and timeframes that allows meaningful indication of current performance | 7.3.7.2 f |
| New Feature: | Need help with your QC configuration? |
|---|---|
| Our customer service system now includes a customer portal where you can log in to track your current support requests. This new feature gives you greater visibility into the work we’re doing and helps keep everything transparent. If you’d like access, just let us know and we’ll set it up for you. |
Contact the Mukon team for expert guidance on your QC setups. Email: support@mukon.co.za Tel: 012 450 0240 |
Mukon Team News
We’re pleased to welcome Lesego Ernest Shemica to the Mukon Services team - Lesego brings fresh energy and dedication with skills that will strengthen our capabilities and help us deliver even more effective client support. With Lesego on board, we’re confident our support function will continue to grow stronger and deliver even greater value.
We hope you enjoyed this newsletter!
Warm regards,
The Mukon Team
References
- ISO 15189:2022. Medical Laboratories: Requirements for Quality and Competence. Clauses 6.6.3, 7.3.7.2, 7.3.7.3. https://www.iso.org/standard/76677.html
- SANAS. F 243-02: Technical Requirements for Medical Laboratories and Blood Transfusion Facilities (ISO 15189:2022). 2023. https://www.sanas.co.za/Publications%20and%20Manuals%20Files/F%20243-02.pdf
- CLSI. Statistical Quality Control for Quantitative Measurement Procedures. 4th ed. CLSI guideline C24. CLSI; 2016. https://clsi.org/media/1365/c24ed4_sample.pdf
- Gruber L, Hausch A, Mueller T. Internal Quality Controls in the Medical Laboratory. Diagnostics. 2024;14(19):2223. https://pmc.ncbi.nlm.nih.gov/articles/PMC11475633/
- Westgard JO et al. A multi-rule Shewhart chart for quality control in clinical chemistry. Clin Chem. 1981;27(3):493-501.
- ASCLS. 'Do No Harm: Diagnostic Errors and the Laboratory.' https://ascls.org/do-no-harm-diagnostic-errors-laboratory/
- Plebani M. Ann Clin Biochem. 2010. DOI: 10.1258/acb.2009.009222
- Wieringa S et al. J Patient Safety. 2023. PMC10662575. https://pmc.ncbi.nlm.nih.gov/articles/PMC10662575/
- Clinical Laboratory News. (2021, December). Total allowable error (TEa): How much error can your laboratory allow? Association for Diagnostics & Laboratory Medicine (ADLM). Total Allowable Error (TEa): How Much Error Can Your Laboratory Allow?